A small example implemented from Anderson (1983)
Format
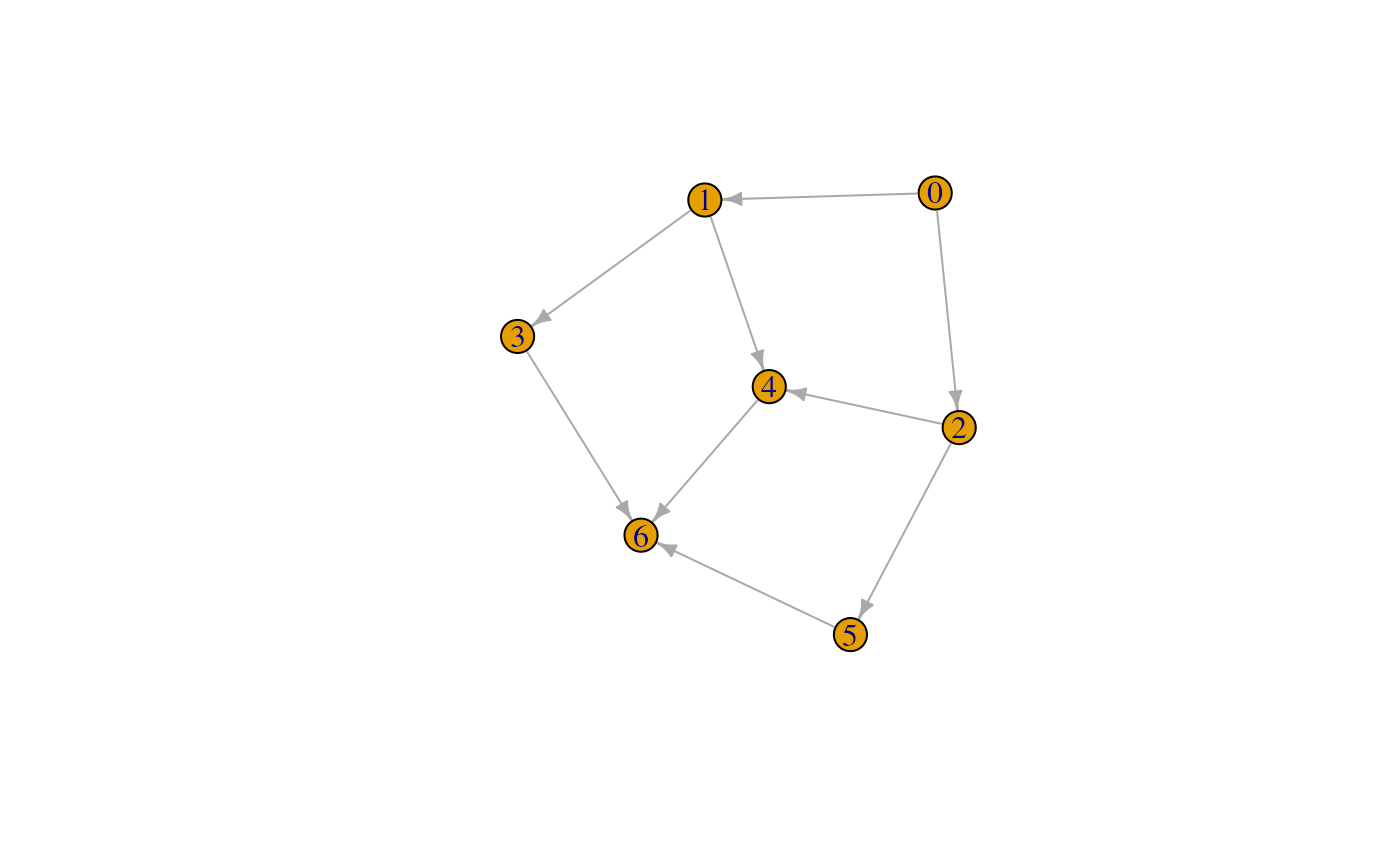
Adjacency dgCMatrix
representing an unweighted directed graph. Inside this adjacency matrix,
each row and column of the matrix represents a node in the graph. There are
7 nodes and 9 edges, and no self-loops inside the graph.
Source
Anderson, J. R. (1983). A spreading activation theory of memory. *Journal of verbal learning and verbal behavior*, *22*(3), 261-295. https://doi.org/10.1016/S0022-5371(83)90201-3.
Examples
library(labyrinth)

data("graph", package = "labyrinth")

dim(graph)
#> [1] 7 7

# Draw the network plots using igraph
# \donttest{
library(igraph)
#>
#> Attaching package: 'igraph'
#> The following object is masked from 'package:labyrinth':
#>
#>     random_walk
#> The following object is masked from 'package:testthat':
#>
#>     compare
#> The following objects are masked from 'package:stats':
#>
#>     decompose, spectrum
#> The following object is masked from 'package:base':
#>
#>     union
graph <- graph_from_adjacency_matrix(as.matrix(graph))
plot(graph)

# }
# }